Prev Chapter 10: Parallel programming examples
Up Main page
Chapter 12: SIMD processing on CPU and GPU Next
11 Multi-GPU programming
Quasar supports multi-device configurations, which allows several GPUs to be combined with a CPU. For the programmer, outside kernel/device functions, the programming model is sequential in nature, irrespective of whether one or multiple GPUs are being used. The Quasar multi-GPU feature allows a program to be executed on multiple GPUs (let say 2), without any/very little changes (see below) to the code, while benefitting from a 2x acceleration.
To achieve this, the load balancing is entirely automatic and will take advantage of the available GPUs, when possible. The run-time system supports peer-to-peer memory transfers (when available) and transfers via host pinned memory. Here, host pinned memory is used to make sure that the memory copies from the GPU to the host are entirely asynchronous.
Each of the GPU devices has its own command queue, this is a queue on which the load balancer places individual commands that needs to be processed by the respective devices. The load balancer takes several factors into account, such as memory transfer times, load of the GPU, dependencies of the kernel function, \SpecialChar ldots
The multi-GPU functionality relies on the scheduler and load balancer in the Hyperion (v2) runtime system; therefore, it is only available for Hyperion devices (v2).
Systems with multiple GPUs contain either multi-GPU boards with PCI Express bridge chip or multiple PCI Express slots. In case of multiple PCI express slots, memory transfers from GPU A to GPU B need to pass the host (CPU) memory. Therefore, there are huge differences between the memory transfer times in the system (e.g. local device transfers, between GPU and the host and between GPU peers). Due to passing the CPU memory, memory transfers between GPUs may not be as efficient as expected, causing overhead and non-linear multi-GPU performance scaling.
It is therefore necessary to have a good understanding of the different factors that affect performance in a multi-GPU system.
11.1 A quick glance
All the memory transfers between the GPUs and between host and GPU, are managed automatically (and reduced as much as possible). In some cases it is useful to have more control about which GPU is used for which task. This can be achieved by explicitly setting the GPU device via a scheduling instruction:
{!sched gpu_index=0}
or
{!sched gpu_index=1}
{!sched} to reset to automatic scheduling
or
{!sched gpu_index=1}
This overrides the default decision of the load balancer. For for-loops this can be done as follows:
for k=0..num_tasks-1
{!sched gpu_index=mod(k,2)}
parallel_do(..., kernel1)
parallel_do(..., kernel2)
endfor
{!sched gpu_index=mod(k,2)}
parallel_do(..., kernel1)
parallel_do(..., kernel2)
endfor
This way, each GPU will take care of one iteration of the loop. To enhance the load balancing over the GPUs, it may also be more beneficial to use the following technique
{!parallel for; multi_device=true}
for k=0..num_tasks-1
parallel_do(..., k, kernel1)
parallel_do(..., k, kernel2)
endfor
for k=0..num_tasks-1
parallel_do(..., k, kernel1)
parallel_do(..., k, kernel2)
endfor
Here, {!parallel for; multi_device=true} will essentially unroll the for-loop twice, where each parallel_do function is launched on a different device. Internally, the following code is generated:
for k=0..2..num_tasks-1
{!sched gpu_index=0}
parallel_do(..., k, kernel1)
{!sched gpu_index=1}
parallel_do(..., k+1, kernel1)
{!sched gpu_index=0}
parallel_do(..., k, kernel1)
{!sched gpu_index=1}
parallel_do(..., k+1, kernel1)
{!sched gpu_index=0}
parallel_do(..., k, kernel2)
{!sched gpu_index=1}
parallel_do(..., k+1, kernel2)
endfor
parallel_do(..., k, kernel2)
{!sched gpu_index=1}
parallel_do(..., k+1, kernel2)
endfor
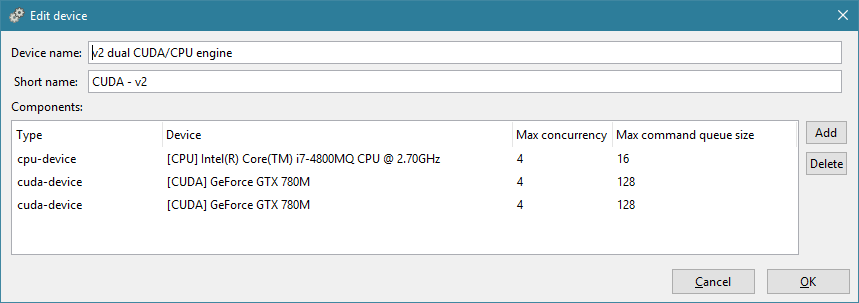
11.2 Setting up the device configuration
A Hyperion device configuration is stored in the application user folder (evaluate
in Redshift to know the location):
quasardir("app_dir")
<quasar>
<computation-engine name="v2 dual CUDA/CPU engine" short-name="CUDA - v2">
<cpu-device num-threads="2" max-cmdqueue-size="32" cuda-hostpinnable-memory="true" />
<cuda-device max-concurrency="4" max-cmdqueue-size="64" ordinal="0" />
<cuda-device max-concurrency="4" max-cmdqueue-size="64" ordinal="1" />
</computation-engine>
</quasar>
A multi-GPU configuration has one CPU device and at least two CUDA devices. The following parameters are available:
|
\raggedright\strut Parameter \strut
|
\raggedright\strut explanation \strut
|
|
\raggedright\strut
|
\raggedright\strut the GPU index (typically 0, 1, 2, 3, \SpecialChar ldots) \strut
|
|
\raggedright\strut
|
\raggedright\strut the number of CPU threads used for launching \strut
|
|
\raggedright\strut parallel kernels (note: each kernel can spawn some more OpenMP threads, \strut
|
|
|
\raggedright\strut this number is determined by dividing the number of logical processor cores by
|
|
|
\raggedright\strut
|
\raggedright\strut the maximum length of the device command \strut
|
|
\raggedright\strut queue (concurrent kernel execution mode only). \strut
|
|
|
\raggedright\strut
|
\raggedright\strut the number of CUDA streams associated to \strut
|
|
\raggedright\strut each device (concurrent kernel execution mode only) \strut
|
|
|
\raggedright\strut
|
\raggedright\strut if true, memory transfers between host CPU and \strut
|
|
\raggedright\strut the GPU(s) will be accelerated using host pinnable \strut
|
|
|
\raggedright\strut (non-pageable) memory. This is required for asynchronous memory copies. \strut
|
A typical maximum size for the command queue is 64. This value strikes a balance between sufficient concurrency on the one hand and buffering and scheduling overheads on the other hand. A good value for max-concurrency is 4, higher values often don’t impact the GPU performance (neither positively or negatively), due to the limited number of kernels that the hardware can run concurrently.
Note that a default Hyperion device configuration is automatically generated by the Quasar installer. Additionally, the Hyperion computation engine can be configured in Redshift via “Configure Devices”:
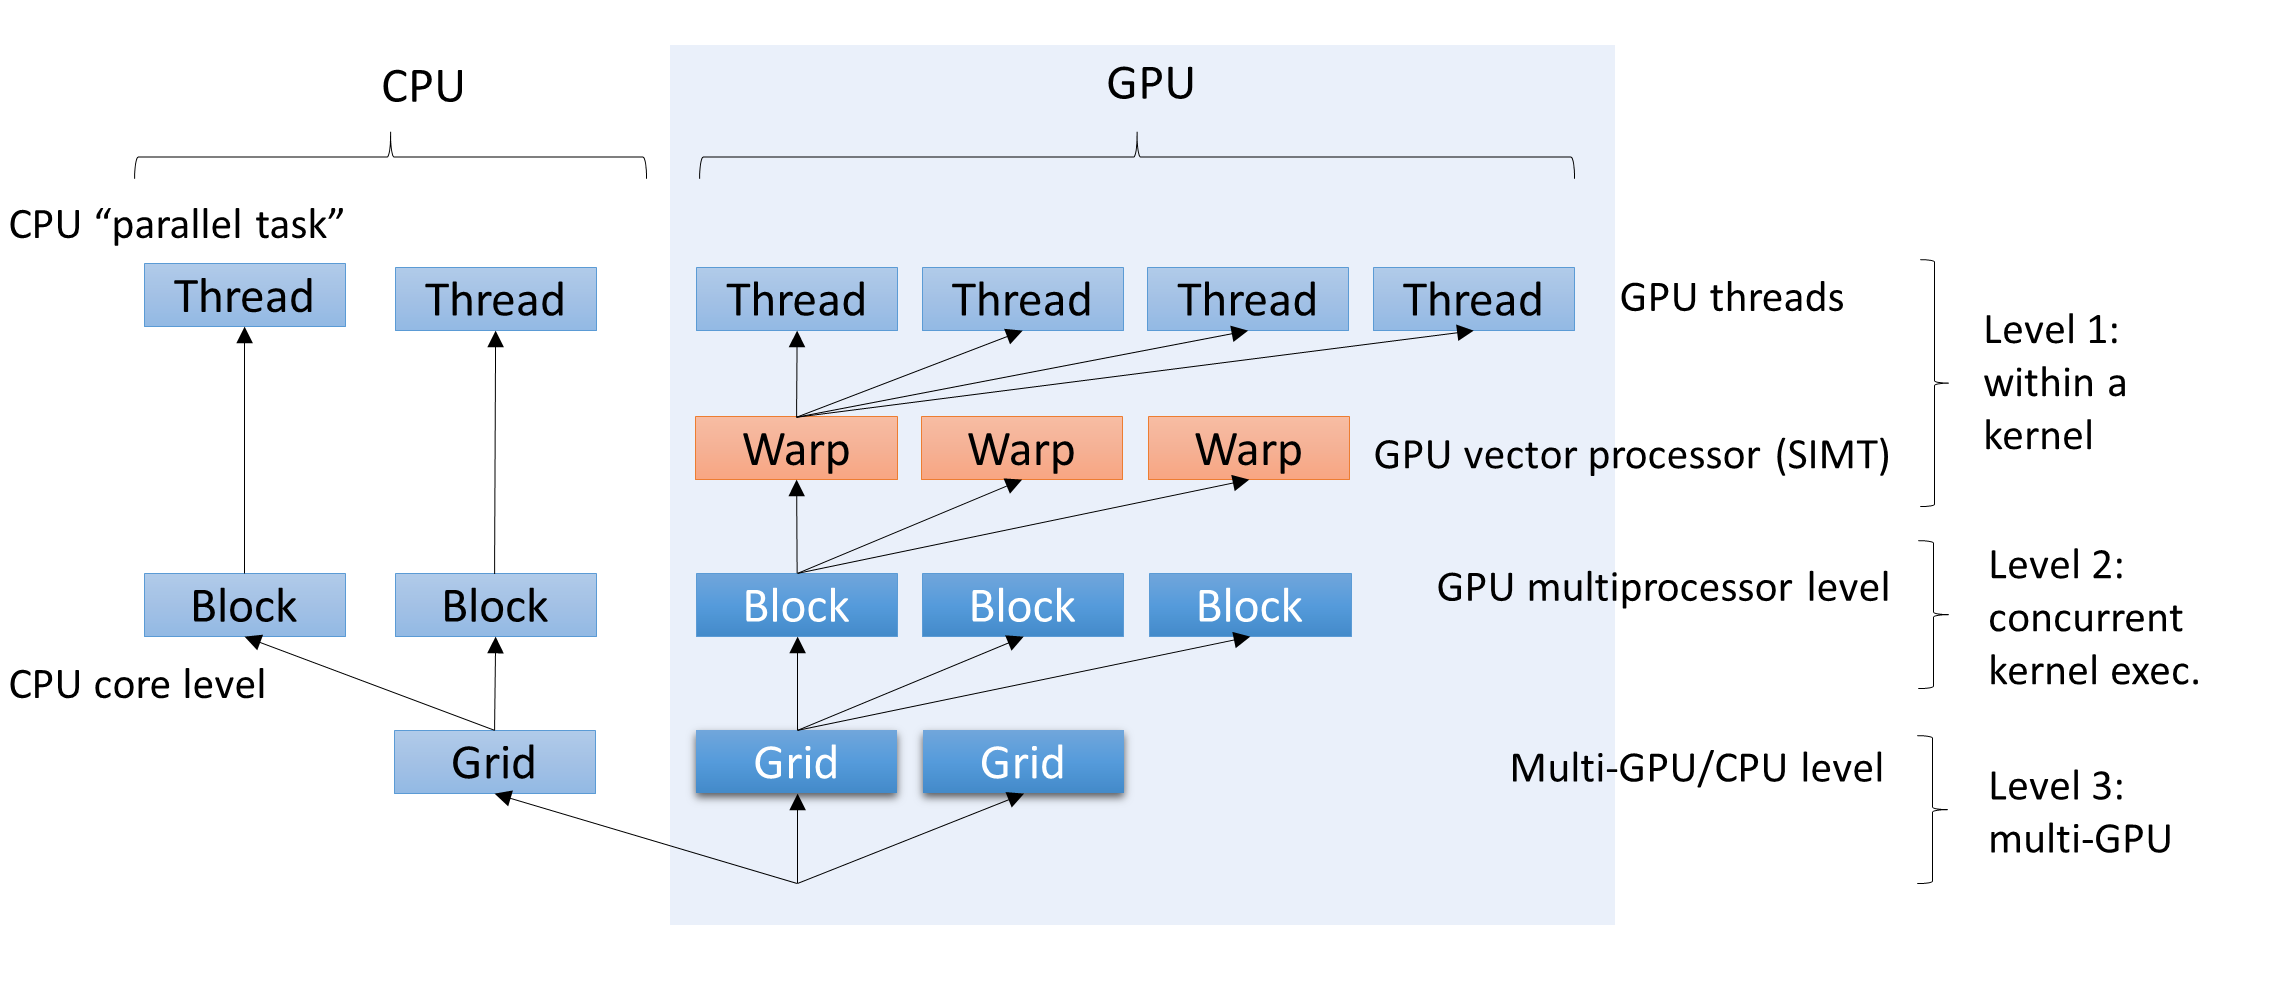
11.3 Three levels of concurrency
Quasar features three levels of concurrency:
-
Level 1: within a kernel: GPU threads are executed in parallel, via or via automatically parallelized for-loops.
parallel_do()
- Level 2: concurrent kernel execution: Quasar will concurrently launch kernels (e.g., by automatically assigning CUDA streams). This requires a runtime option (“concurrent kernel execution”) to be enabled. When one GPU is not fully occupied (e.g., due to a low occupancy), the GPU may execute subsequent kernels concurrently.
- Level 3: multi-GPU processing: kernels can be launched on different GPUs in the system.
This requires:
- load balancing, to ensure that each GPU is sufficiently (or maximally) utilized
- scheduling: kernel launches may be reordered in order to obtain a better device utilization
- automatic memory transfers (peer-to-peer) between GPU devices. As mentioned before, the peer-to-peer copies may pass the CPU host memory. This is to be avoided, so this issue is also taken into account by the runtime system when making scheduling and load balancing decisions.
For each of the three concurrency levels, Quasar has an automatic mode. It some cases it may be beneficial to switch to the manual mode as well, e.g., to take control in own hands or to further optimize the program.
11.4 Manual vs. automatic multi-GPU scheduling
Quasar supports two multi-GPU scheduling modes:
- Automatic scheduling: the scheduling and load-balancing algorithm decides fully autonomously on which GPU (or CPU) to execute the given kernels. This is a fairly sophisticated algorithm that not only takes kernel/task dependencies into account, but also the memory state, the required memory transfers (e.g., peer-to-peer copies) and synchronization between the GPUs.
- Manual scheduling: here the user specifies which sections of the code run on which GPU. This is mostly useful when the code lends itself for logical separation onto multiple GPU.
Both modes can be used interchangedly during the program execution: the automatic scheduling takes the manual scheduling rules into account. Therefore, it is perfectly possible that both techniques complement each other. In the following, we explain in more detail how this is done.
In Quasar, the scheduler can be controlled via code attributes (Quasar’s equivalent for pragmas and attributes in other programming languages).
|
\raggedright\strut Code attribute \strut
|
\raggedright\strut explanation \strut
|
|
\raggedright\strut
|
\raggedright\strut sets the scheduling mode to automatic \strut
|
|
\raggedright\strut
|
\raggedright\strut sets the scheduling mode to CPU, meaning that the \strut
|
|
\raggedright\strut \strut
|
\raggedright\strut following kernel functions will be executed on the CPU \strut
|
|
\raggedright\strut
|
\raggedright\strut sets the scheduling mode to GPU, \strut
|
|
\raggedright\strut \strut
|
\raggedright\strut meaning that the following kernel functions will be executed on the GPU \strut
|
|
\raggedright\strut
|
\raggedright\strut sets the scheduling mode to GPU
|
|
\raggedright\strut \strut
|
\raggedright\strut meaning that the following kernel functions will be executed on GPU
|
|
\raggedright\strut
|
\raggedright\strut retains the scheduling mode, but sets GPU
|
|
\raggedright\strut \strut
|
\raggedright\strut The following kernel functions scheduled to the GPU will be executed \strut
|
|
\raggedright\strut \strut
|
\raggedright\strut on GPU
|
When the GPU scheduling mode is not specified from within the code, the scheduler will automatically assign a GPU depending on the current load of the GPUs (automatic scheduling) and the associated memory transfer costs. Switching to manual mode can be performed by one of the above scheduling code attributes. At any point in time, it is possible to switch back to automatic scheduling, by means of
.
{!sched mode=auto}
During scheduling, it may occur that some kernel functions have preference for a certain GPU, while other kernel functions have not. The scheduler takes the preferences into account, so that unassigned kernel functions may be scheduled to the other GPU, if available.
Additionally, it is possible to manually copy variables to a specified GPU target:
|
\raggedright\strut Code attribute \strut
|
\raggedright\strut explanation \strut
|
|
\raggedright\strut
|
\raggedright\strut Copies the variable
|
|
\raggedright\strut
|
\raggedright\strut Copies the variable
|
|
\raggedright\strut
|
\raggedright\strut Copies the variable
|
Important to know is that the above code attributes should be used only when necessary (e.g., when profiling has indicated that it is advantageous):
- Using these code attributes incorrectly may lead to unnecessary memory transfers
-
Additionally, a transfer operation involves a scheduling synchronization, leading all the pending kernels for variable to be launched immediately. This may interfere with the scheduling algorithm leading to a degraded performance.
A
11.5 Host Synchronization
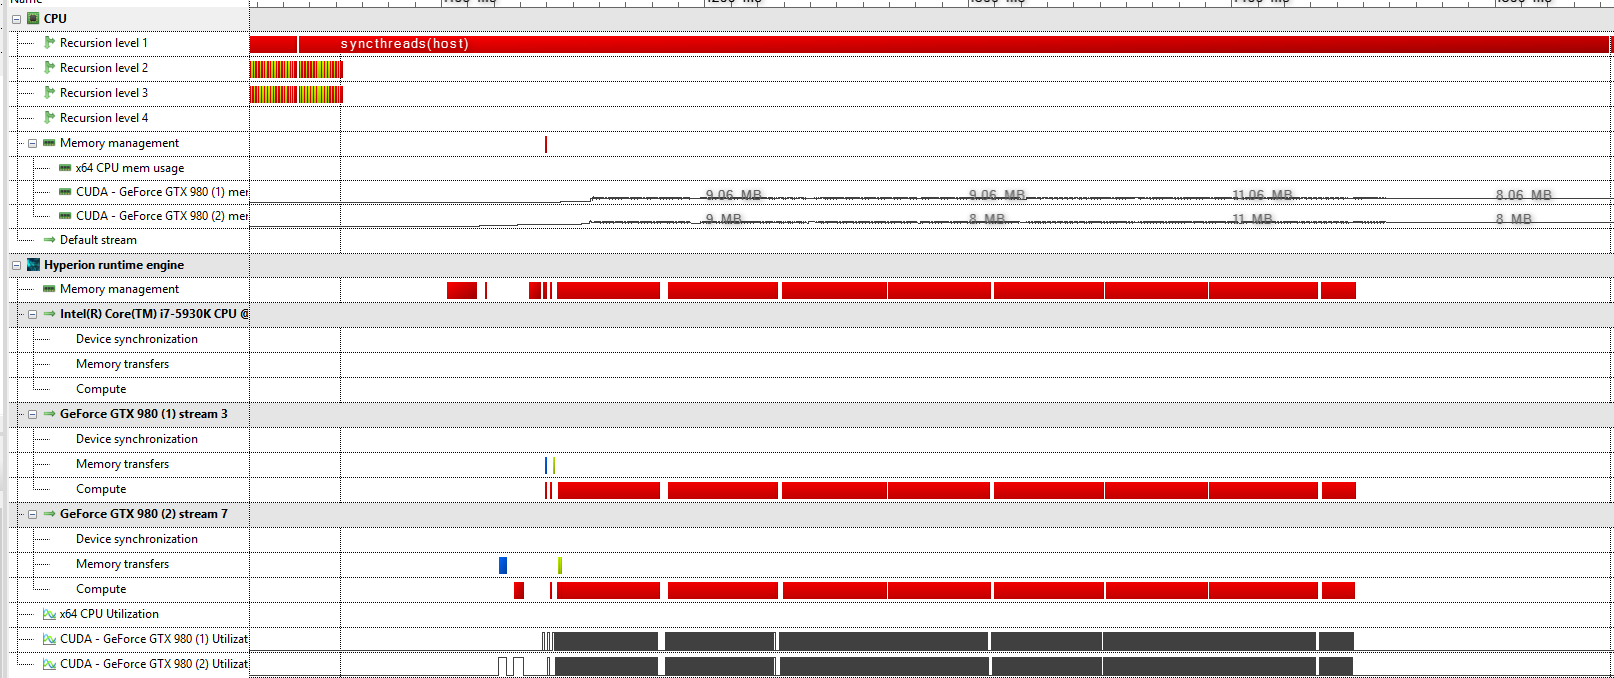
The global scheduling algorithm generally only launches kernels at the moment that the results are needed (e.g., for further processing on the host CPU or for visualization). To enforce all pending kernels to be launched, a host-wide barrier can be used using
. This function works similar to
, but with the difference that all computation devices in the system will be synchronized. Below is a screenshot of the Redshift profiler that shows that
performs a lot of work: in fact a whole batch of kernel functions is launched.
syncthreads(host)
syncthreads(block)
syncthreads(block)
One subtle issue to be aware of is that measuring time differences in a multi-GPU environment using
and
may not give the desired results: it is possible that all kernel functions in between
and
are postponed for execution and in that case
will result a very small time difference (e.g., 1 microsecond). To correct the timing, it is best to synchronize the devices:
tic()
toc()
tic()
toc()
toc()
tic()
parallel_do(...)
syncthreads(host)
toc()
parallel_do(...)
syncthreads(host)
toc()
The reason that
does not implicitly imply
, is that host synchronization breaks concurrency: suppose that we would have the following code fragment:
toc()
syncthreads(host)
tic()
{!sched mode=gpu; gpu_index=0}
parallel_do(...)
syncthreads(host)
toc()
{!sched mode=gpu; gpu_index=0}
parallel_do(...)
syncthreads(host)
toc()
tic()
{!sched mode=gpu; gpu_index=1}
parallel_do(...)
syncthreads(host)
toc()
{!sched mode=gpu; gpu_index=1}
parallel_do(...)
syncthreads(host)
toc()
Here, the host barrier would cause GPU 2 to be idle in the first
block and correspondingly, GPU 1 is also idle in the second
block. To measure independently how long work takes on GPUs 1 and 2.
tic()...toc()
tic()...toc()
The execution times of a kernel on a GPU can therefore not be measured independently, at least not when other kernels are running on the other GPU. To optimize execution performance, it is nevertheless useful to have these independent measurements. These can be achieved using the built-in profiling tools.
11.6 Key principles for efficient multi-GPU processing
There are 5 key principles to be applied to enable efficient multi-GPU processing:
- Compute intensive kernels: the program contains enough kernels that are compute-bound (i.e., not limited by memory or register restrictions). In case a program does not fully utilize a single GPU, its performance will most likely not be improved by using multiple GPUs. It is therefore recommended to optimize performance first on a single GPU, before attempting to get performance benefits by switching to multiple GPUs.
-
Inter-kernel concurrency: there must exist concurrency between kernels within a window of subsequent launches. Typically,
N
is quite large (e.g.,N
) to detect sufficient concurrency. Often, dependencies between kernel functions exist, which means that a kernel function needs to wait for the result of another kernel function. This is fine, as long as a kernel does not need its results from different GPUs. If this is the case, a peer-to-peer copy between the GPUs is performed, which may have one subtle drawback: during the peer-to-peer copy, both GPUs are involved and the copy performs synchronization between the two devices. Luckily, the scheduler can detect this situation and work around it. Correspondingly, the programs that benefit the most from multi-GPU acceleration and that can enjoy linear scaling, are the programs in which logical separation is possible between the GPUs and for which limited data transfer between the GPUs is required.N=32768
-
Aggregation variables impose device synchronization: whenever a scalar result is obtained (for example, by calling the function), the CPU synchronizes with the GPU device. The corresponding kernel function (together with its dependencies) needs to be executed immediately. This significantly reduces the freedom of the scheduler in reordering the operations. To avoid this problem, it is beneficial to use vectors of length 1:
sum()
function [] = __kernel__ calc_sum(result : vec(1), data : cube, pos : vec3)
result += data[pos]
endfunctionThis approach is more efficient than using the return parameters of the kernel function (which are currently immediately read by the CPU when the kernel function is complete). Only when directly accessing the content of the vector:result
print result[0]a device synchronization will be performed.A related subtle side effect is when passing vectors/matrices with small dimensions () to a kernel function. Because these objects are passed directly to the registers of the kernel function, the values are read-out by the CPU. To avoid this problem, it is best to omit the length of the vector or size of the matrix in the kernel function definition.numel(x)<=64
function [] = __kernel__ process(mean_location:vec, pos:int) % vec instead of vec(3)
endfunctionNote that this problem only occurs for objects that are being written in one kernel and read in a subsequent kernel. For read-only data, there is no problem. - Memory transfers between host and GPU should be avoided as much as possible, for the same reason as above. In concurrent kernel execution mode, the runtime performs asynchronous memory transfers, therefore the issue from point 3 does not apply. Because memory transfers are implicit, a program may perform more memory transfers to intended. It is then useful to investigate the profiling results (e.g., the profiling timeline in Redshift) to find the origins of the memory transfers.
- Avoid duplicate calculation within loops: when a constant intermediate value (vector, matrix or cube) is required, this value should not be recalculated over and over again, requiring repeated GPU transfers. Instead it is better to compute the value once and reuse it. The runtime keeps the memory resident in multiple GPUs, so that no GPU transfers are requires for kernel functions using the value.
In order to reach linear multi-GPU scaling, it is necessary to take the above principles into account.
11.7 Supported Libraries
Currently all built-in Quasar functions support multi-GPU processing. Furthermore, the following CUDA libraries have been enabled:
- cuFFT: Fast Fourier transforms
- cuBLAS: Basic Linear Algebra subprograms(*)
- cuSolver: Solvers for linear systems
- cuDNN: Deep neural networks
In automatic scheduling mode, the Quasar runtime will automatically dispatch the CUDA library functions to the available GPUs.
(*) Some of the cuBLAS functions, in particular those that result a scalar value, perform implicit device synchronization by default. Therefore these functions do not offer a lot of multi-GPU benefits for the moment. In a future version, this issue will be mitigated.
11.8 Profiling techniques
To speed up Quasar programs that do not take optimally advantage of the available GPUs, it is necessary to determine which key principle(s) that is/are violated. For this purpose, using the Redshift profiler, several techniques can be used to analyze the behavior of multi-GPU programsThe profiler incorporates the CUDA Profiling tools (CUPTI), which are also used by NVidia NSight and NVidia Visual Profiler. In contrast to the NVidia NSight and Visual Profiler, the Redshift profiler links the kernel functions directly to the host functions and the source code; therefore, it is possible to obtain extra information, such as which code initiated a particular memory allocation or memory transfer, which parameters are passed to a given kernel function etc. The GPU events view gives the specific order of the commands that are being sent to the GPU, together with the relevant source code links.
In this section we discuss several profiling techniques that are useful to identify potential multi-GPU execution issues.
-
Identify whether compute intensive kernels are present: compute intensive kernels can easily be spotted in the timeline view. Ideally, subsequent kernels should start immediately, with no gap in between. So for example the single GPU execution of the test program:
guided_filter.q
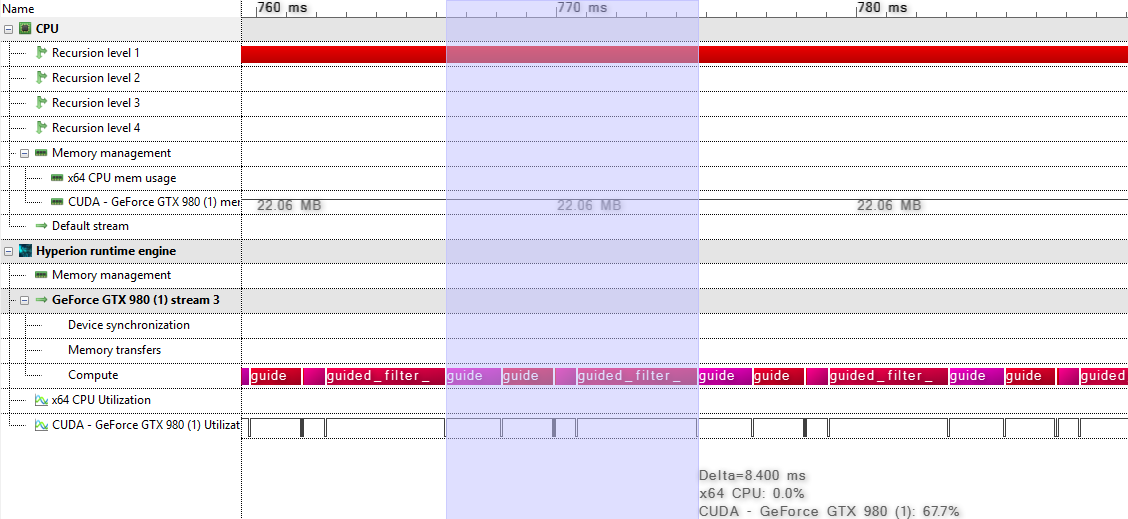
Here, all kernels are contiguously executed. Due to the low number of dependencies between the kernels, automatic multi-GPU scheduling will yield linear scaling, as demonstrated by the following multi-GPU execution:
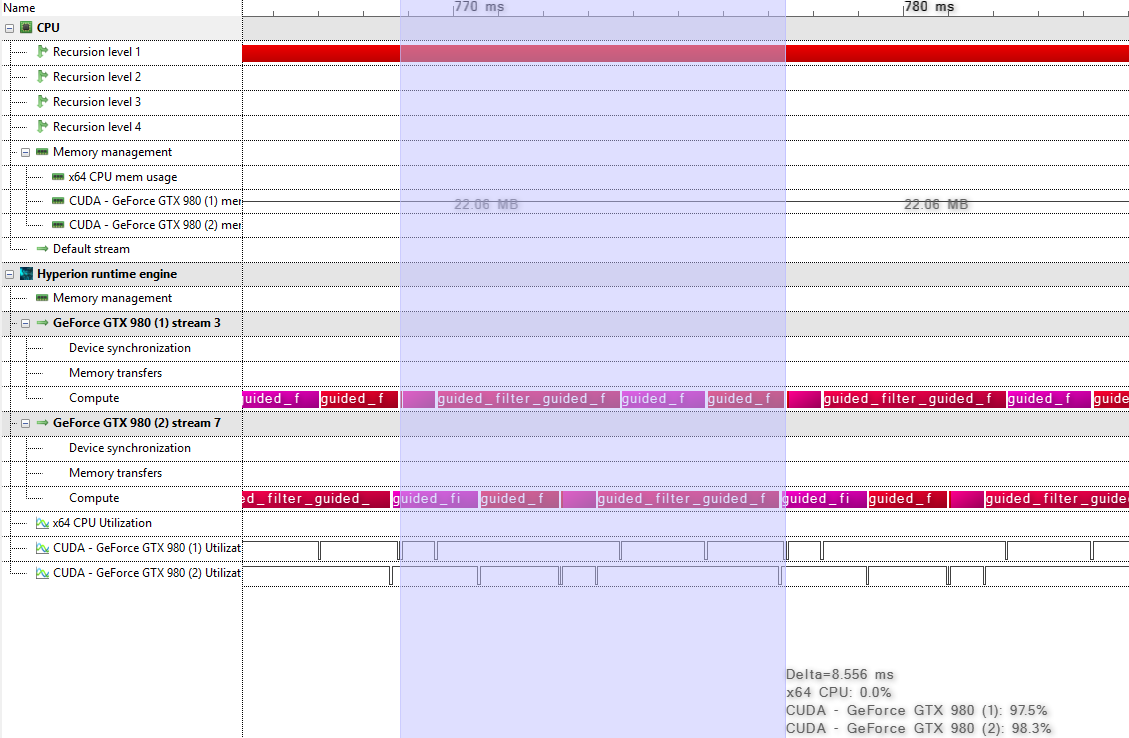
No code changes were required to obtain the multi-GPU execution. It sufficed to switch from the CUDA to the dual CUDA device.
- Check inter-kernel concurrency: dependencies between kernels can be inspected in the Redshift profiler view.
-
Check device synchronization: calls to the global scheduler can be found in the device synchronization track with label . The device that contains
sync_event(global_sched)
is the device that is being synchronized.sync_event
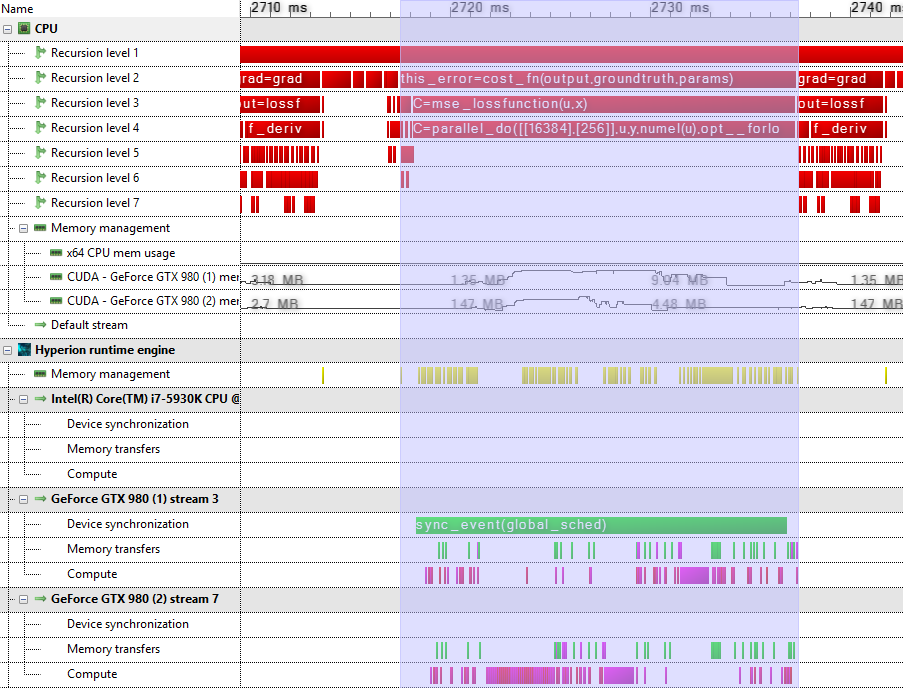 Host functions are indicated in red, memory allocations in yellow, executed kernel functions in magenta and memory transfers between GPUs in green.In this case, it is useful to check whether the scheduler invocation can be avoided. By inspecting the tooltip ofand clicking onto “view in code workbench”, it is possible to track down the variable that causes the device synchronization.
sync_event(global_sched)
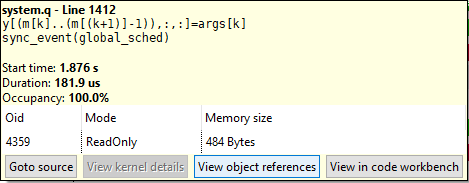 The tooltip also shows a table containing the object identifier (), access mode and memory size. In Quasar, each object (e.g., vector, matrix) has a unique identifier. The
oid
is displayed in the GPU events view and in the memory profiler. By clicking onto “View object references”, all operations on this object can be visualized. In this case, the CPU is accessing a variable with size 484 bytes. This requires the global scheduler to be invoked. Note however that the global scheduler may also work without any particular device synchronization being required: this is the result of the global scheduling queue being full.oid
Additionally, in the above screenshot, note the high number of peer to peer memory transfers indicates a poor usage of both GPUs: peer to peer memory transfers block both involved GPUs and therefore severely impacts the multi-GPU scaling. -
Check for memory transfer bottlenecksMemory bottlenecks can be identified in the memory transfer summary view. Displayed are the type of transfer (e.g. from CPU to GPU, from GPU to CPU, between GPU peers), the number of times that this memory transfer took place, minimum, average and maximum duration of each transfer, etc.
 The tooltip of this report allows to directly browse to the source code that caused this memory transfer. Additionally, object identifiers (oid) can be tracked via the GPU events view.
 -
Check for duplicate calculations/operations in the GPU events viewThe GPU events view gives a listing of all the commands executed on the GPU. See the documentation on the enhanced profiler for the details.
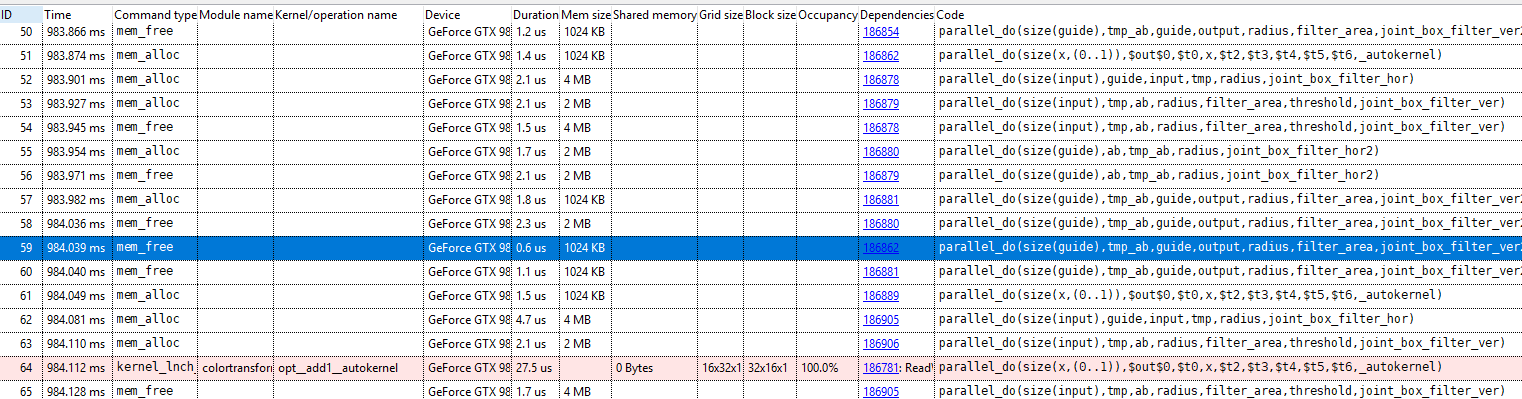 In particular, it is important that a result is only calculated once, when it is used several times. This way, the runtime can keep a copy of the data resident in the device memory of each of the GPUs.
11.9 Automatic GPU scheduling
When the GPU scheduling mode is not specified from within the code, the scheduler will automatically assign a GPU depending on the current load of the GPUs and the associated memory transfer costs. For this technique to be effective, it is currently required that the code is structured in such a way that subsequent kernel calls can be parallelized over the different GPUs, with limited memory transfer. In case the scheduler detects large overheads due to memory transfers, it is very likely that the code will be executed on only one GPU. However, when the code (mostly) contains parallel operations on separate memory blocks (matrices etc.) with only few synchronizations between the GPUs, the automatic GPU scheduling will be able to detect the coarse grain parallelism and the program will be able to use multiple GPUs.
11.10 Developing multi-GPU applications
A practical workflow for developing multi-GPU applications is then as follows:
- Start from a Quasar program that is multi-GPU agnostic (i.e., that runs on a single GPU).
- Profile the program and determine the code regions in which the automatic GPU scheduling (Section 11.9↑) is ineffective.
- For these regions, insert manual scheduling commands as outlined in Section 11.1↑
Note that even after adding manual scheduling commands, the program can still work in single-GPU mode, without any changes (no error is generated when gpu_index is larger or equal than the number of available GPUs!) However, improper use of {!sched} may lead to performance degradations, so it is recommended to profile the multi-GPU application regularly.